The Hochvogel seismic observatory - tracing the collapse of an Alpine peak
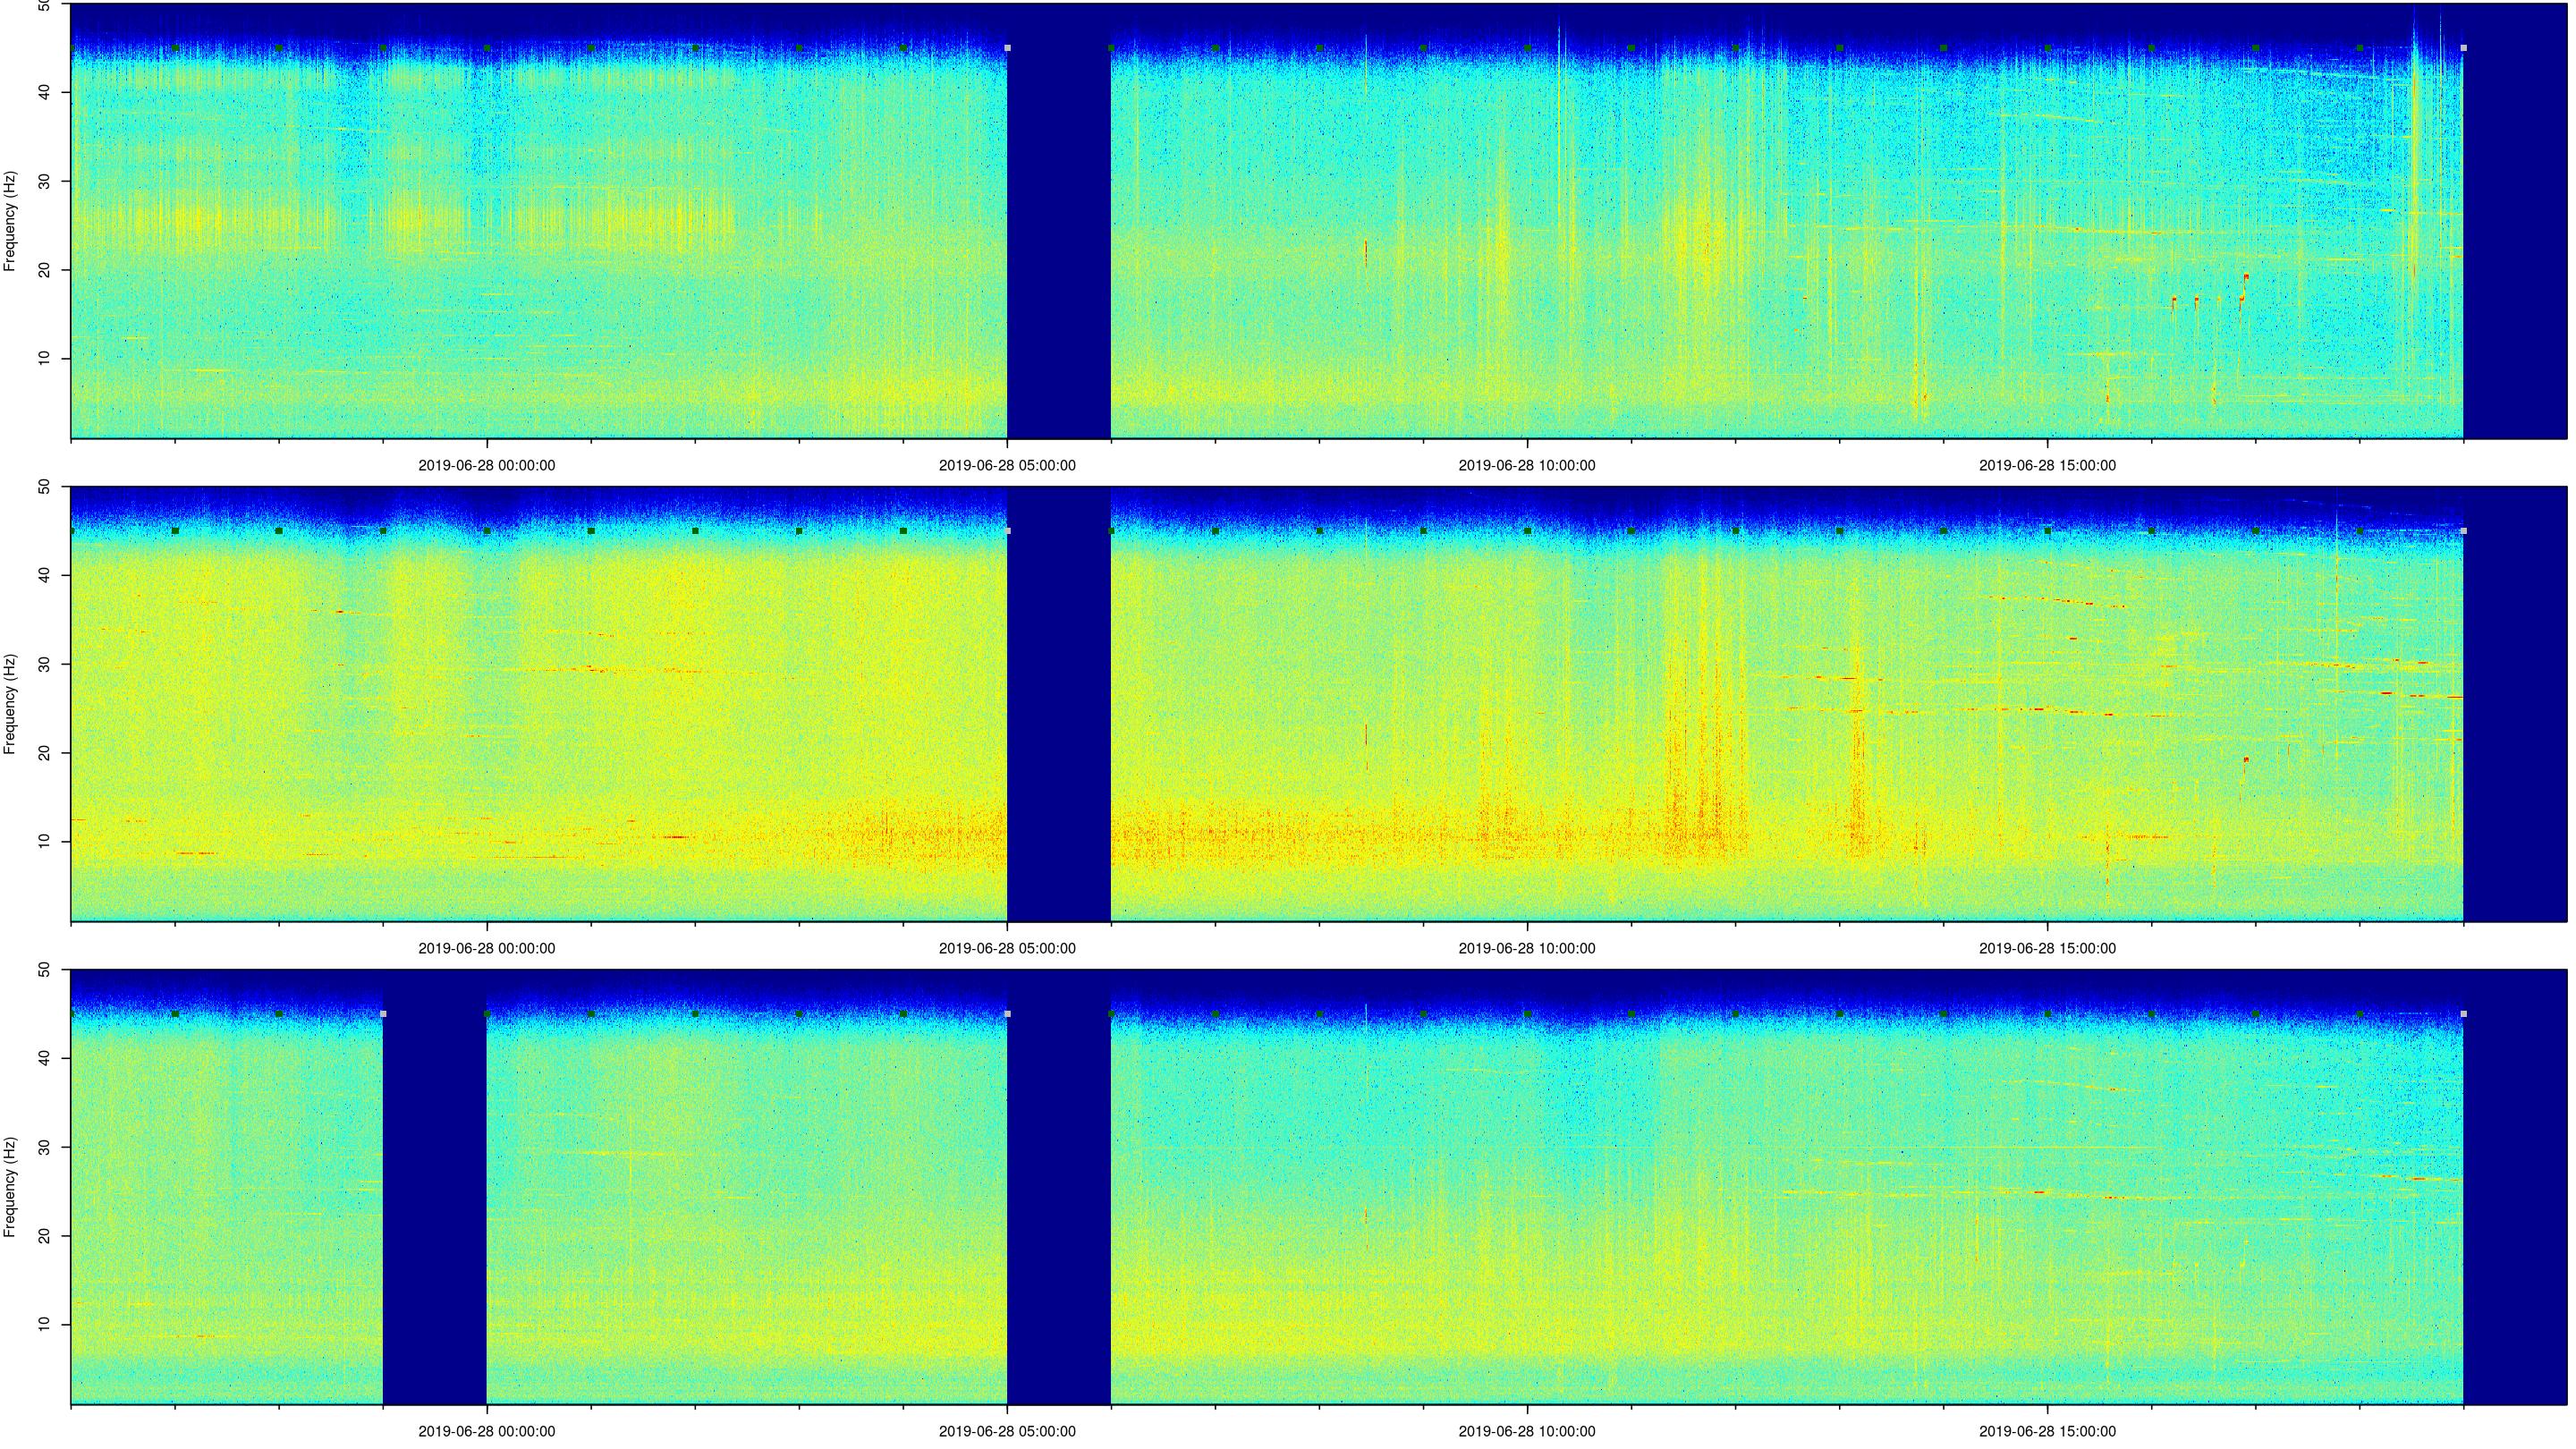
The following plots contain hourly to daily updated data of the seismic antenna on the Hochvogel peak, Allgäu. The signal traces (first plot) are organised in 30 minute line plots covering the last 3 hours. The spectrograms (second plot) depict the evolution of the spectral signal properties with time and are organised by seismic station, covering the last 3 hours. The battery plot panel (third plot) shows the balance between solar input and station power consumption over the last 10 days.


